Determine the area
Which supported Census geography contains this coordinate? Nearby points can belong to different tracts; a nearby place name is not enough.
Spatial context for AI
AudienceMap gives AI applications source-backed geographic context. Starting with a coordinate, it identifies a supported Census area and connects it to published demographic statistics—with sources, reporting periods and uncertainty preserved.
We are building a managed service so your team can ask geographic questions without building and maintaining its own boundary-processing pipeline.
Verified local sample available now. Managed service access is in development.
The idea at a glance
See how AudienceMap connects a location to its Census area and published demographic context.
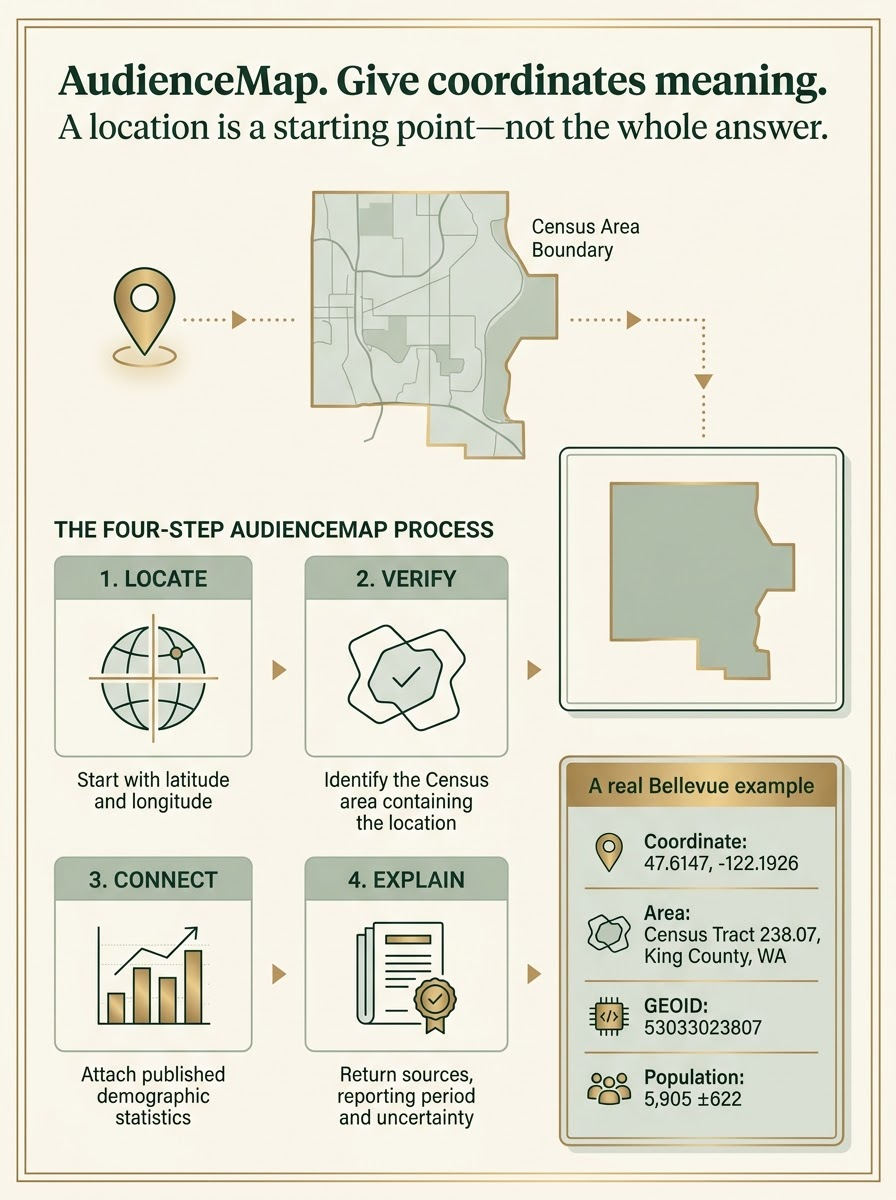
Schematic illustration—not an authoritative Census boundary map. Bellevue population: 2020–2024 ACS 5-year estimate; ±622 is the published 90% margin of error. Statistics describe the tract, not a person or property. Saved local example; managed API and MCP access are in development.
View full-size infographic ↗Read the four-step process ↓Why the geographic lookup matters
An AI-generated geographic answer is not a substitute for a spatial computation. AudienceMap is designed to handle the geographic lookup and evidence retrieval, so the model can focus on explaining the result.
Which supported Census geography contains this coordinate? Nearby points can belong to different tracts; a nearby place name is not enough.
Which published statistics belong to this geography and reporting period? Connect the area's official identifier to the matching Census estimates.
What does the result mean, and where does it stop? Retain sources, coverage and uncertainty. Area statistics are not facts about an individual household.
Location + area context
AudienceMap connects a supported coordinate to its Census tract, then links that tract to published demographic statistics through its official geographic identifier (GEOID).
Identify the containing Census tract. A coordinate is not automatically a verified rooftop, building or property.
The Bellevue sample includes population, households, median household income, housing units, renter-occupied housing units and median age.
Each of these six measures includes its units, survey period and published 90% margin of error. Source references make the answer inspectable.
A Census tract is a statistical area, not necessarily a named neighborhood. Five-year ACS estimates describe a survey period—not a current snapshot of residents. This sample contains no property profiles or individual household records.
Explore the six verified measures ↓The evidence, not just the promise
A Census tract is a small statistical area, not necessarily a named neighborhood. This verified local example identifies the containing tract in King County, Washington, and connects it to aggregate American Community Survey (ACS) statistics. The controls show saved results—not a live API or nationwide search.
Population
5,905± 622people · 90% MOEHouseholds
3,525± 298households · 90% MOEMedian household income
$200,428± $23,8082024 inflation-adjusted USD · 90% MOEHousing units
3,836± 287housing units · 90% MOERenter-occupied housing units
2,799± 283occupied housing units · 90% MOEMedian age
39.5± 4.6years · 90% MOEThese estimates describe the entire tract—not a person, household or property at the coordinate. ± indicates the published 90% margin of error. This profile always refers to the primary Bellevue example, regardless of the selected trace above.
Take the evidence with you
Review the sample offline or share this page instead of sending an email attachment.
The ZIP includes a readable brief, three saved coordinate examples, six ACS measures for the primary Bellevue tract, preserved Census source responses and a file-integrity manifest.
Public sample only: no private implementation, property records, credentials or recipient details. Saved results—not a live API. Source hashes support integrity checks, not a guarantee of source accuracy.
279d711e5ea9d1d5fb73ec1e22dc0c188ba60a5aee7d435b69017e5c3824d5e9
One task, explained
Illustrative agent workflow using the verified Bellevue result. A future API or MCP integration would automate the lookup; no live integration is demonstrated here.
The application asks
For 47.6147, −122.1926, identify the Census tract, report its population and median household income, and explain what those figures tell us about this location.
The saved evidence supports
This point lies in Census tract 238.07 (GEOID 53033023807). The 2020–2024 ACS five-year estimates report 5,905 people (±622) and median household income of $200,428 (±$23,808, 2024 inflation-adjusted USD). Both margins of error are published at the 90% confidence level.
These figures describe the tract as a whole. They do not establish the income, characteristics or circumstances of any person or household at this coordinate.
Inspect the Census sources & retrieval hashes ↗A simulation or agent benchmark could use versioned Census geography and aggregate statistics as a reference while keeping synthetic scenarios separate from observed evidence. The saved 0,0 case tests how an agent handles no match within King County coverage—not whether the coordinate is globally invalid.
A small response. A rigorous path.
AudienceMap identifies the Census area containing a coordinate, verifies the boundary match, and connects the result to published demographic statistics—with source periods and uncertainty preserved.
Start with a latitude and longitude and check the available coverage.
Identify the Census area whose boundary contains the location.
Attach published statistics using the area's official identifier (GEOID).
Return the result with its sources, reporting periods and uncertainty—or an explicit no-match.
Boundary matches are relative to the retrieved Census geometry, not a legal or cadastral boundary determination. Production latency and throughput have not yet been benchmarked.
What verification means here
The current demonstration checks the geographic match, the statistical join and the ability to reproduce the saved result. These checks support a scoped pilot, not a promise of error-free geography or AI reasoning.
The primary Bellevue tract agrees with an independent Census Geocoder lookup. Boundary matches remain relative to the retrieved Census geometry—not a survey-grade determination.
The ACS geographic identifier matches the resolved tract. Estimates retain their units, reporting period and published margins of error; area-wide figures are not attributed to individuals.
Saved source responses and integrity hashes support repeatable checks. The recorded offline replay reproduced the sample identically. Hashes detect changed bytes; they do not prove that a source is error-free.
Outside King County sample coverage, the demonstration returns no match rather than inventing an answer. Building verification and automatic geocoding-anomaly detection are not demonstrated. Hosted API and MCP validation remain part of pilot testing.
Inspect the Census sources & retrieval hashes ↗For AI labs and systems integrators
AudienceMap is being built for teams that need geographic evidence inside an application or agent workflow, with two complementary uses: retrieve supported context and test whether an agent interprets it correctly.
Move geographic computation out of the model's generated answer. The API and MCP workflow is designed around a simple exchange: request a supported Census area and sourced statistics, then explain the evidence or report no match.
Use versioned coordinates, boundaries and expected results to test geographic selection, source attribution, reporting periods and uncertainty. These are bounded reference cases—not an absolute ground-truth system.
Managed access is designed to cover boundary processing, compatible statistical releases and evidence metadata, so your team can integrate the results instead of operating that pipeline. Public data is the foundation; maintained access is the service.
Who it’s for
For teams connecting locations to Census context through managed API and MCP access. These use cases describe where the service can fit—not existing customer deployments.
Ground location-based answers and build versioned reference cases for evaluating geography, source attribution, uncertainty and missing coverage.
A geographic evidence tool—not a rooftop-recognition or model-training platform.
Enrich customer-supplied locations with tract population, household, income and housing context for area profiles and exploratory comparisons.
Census context—not foot traffic, drive-time catchments or a demand forecast.
Add sourced area-level context alongside customer-owned property records, while keeping property attributes separate from tract-wide estimates.
Not a valuation, title check or statement of an individual household’s income.
Support local area profiles and evidence-based explanations with official geography, statistical periods and published uncertainty.
Context for analysis—not an eligibility decision or a measure of service need on its own.
Use Census context as a supplementary area-level input alongside separately sourced hazard and property evidence.
Not a flood assessment, rooftop verification or underwriting decision. Domain-specific review remains necessary.
Connect facility or planning locations to aggregate Census context for research and reporting within a broader workflow.
Not a building-height model, solar-yield estimate, obstacle map or navigation service.
Start with the supported geography: the current demonstration covers King County Census tracts, with six ACS measures for the primary Bellevue example. Additional datasets, wider coverage and industry-specific requirements need separate validation.
Define a pilot for your workflow ↓The service we are building
AudienceMap is being built as a managed service on Google Cloud (GCP), with REST API access for applications and a Model Context Protocol (MCP) tool for AI agents. The interface is designed to return the supported area's identifier, selected statistics and evidence metadata—not a large polygon file to interpret.
AudienceMap would maintain the boundary-processing and demographic-update pipeline. Your team would use checkable geographic answers in its own product. This can support spatial retrieval-augmented generation (spatial RAG): retrieve geographic evidence first, then let the model explain it.
API + MCP in developmentPOST /v1/spatial/context
{
"latitude": 47.6147,
"longitude": -122.1926,
"geography": "tract",
"acs_release": "2024_5year"
}MCP interface preview: resolve_spatial_contextSaved King County coordinate-to-tract results with ACS statistics connected by official GEOID. The primary result agrees with an independent Census Geocoder lookup.
Confirm query types, geography, boundary cases and acceptance criteria. Then validate hosted REST/MCP behavior, access controls and end-to-end performance.
Pilot planning · not an existing customer integration
Where is geographic context difficult to retrieve or evaluate in your workflow? Start with one representative task, then agree on a small pilot rather than assume a fit.
Specify the input coordinates, supported geography, requested statistics and source periods. Agree on the response structure and how the application or agent will consume it.
Pin reference data and expected results. Include near-boundary points, outside-coverage queries, unavailable statistics and unsupported periods. Define exact-border behavior before scoring those cases.
Validate API and MCP behavior, access controls and input/log handling. Measure end-to-end latency, response size and throughput under an agreed workload; compare results with acceptance criteria set before testing.
The current demonstration covers King County Census tracts and six ACS measures for the primary Bellevue example. Municipal boundaries, flood zones, zoning, building heights and property profiles are not included. Public API access is not yet open.
The sample uses public U.S. Census boundaries and aggregate ACS statistics with traceable sources. Customer inputs, logs, additional datasets and downstream uses still need appropriate privacy, rights and access controls.
From point to context
Start with the verified example. Public API access is not yet open.
Contact Constantine
Have a question about AudienceMap, the sample or a pilot? Tell me what you’re building and the geographic context you need.
Prefer email? constantine@aitrailblazer.com